Expanding Your Wealth of Knowledge Through Financial Literacy
In order to raise public awareness about the importance of financial education in the U.S., April is designated Financial Literacy Month. Research shows that individuals who have a deeper understanding about personal finances are better prepared for financial management and long-term economic success [1]. Three strategies that we can use to help our students build a foundation for financial literacy are further educating ourselves, becoming familiar with financial education standards, and integrating financial literacy concepts and skills into our current curricula. In honor of Financial Literacy Month, let’s explore these objectives along with ideas on how we can incorporate financial education using the TI-Nspire™ CX II graphing calculator and TI-Nspire™ CX Premium Teacher Software. How You Can Help Your Students Become More Financially Literate
1. Educate yourself
I will be the first to admit that I don’t know everything there is to know about finances. However, I am a strong believer in educating myself. Start by taking this short financial literacy quiz to assess your own financial knowledge. The first step to understanding your own finances is to do a financial asset inventory. A simple way to do this is to create a spreadsheet, or document like this one, to organize and record your financial assets. Once you know what you have, you will be better able to manage.
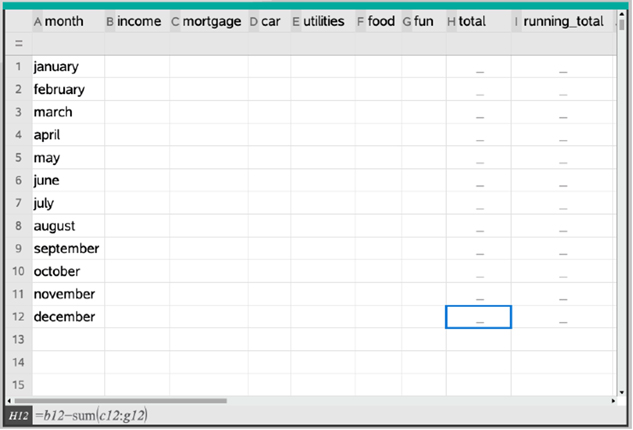
Next, create a budget. Once again, a spreadsheet (figure 1) or app could be the best way to keep track of the money going in and out of your account. The Balance provides a guide on “How To Make a Personal Budget in 6 Easy Steps.” Once you have a better grasp of your spending and saving habits, you can start considering investments. NerdWallet has an excellent article with tips and strategies for beginners. Start exploring options and plans for making your money grow. Putting off investing until later can actually cost you more money than you might realize. For more information, read “6 Reasons Why You Should Start Investing Right Now.” It is never too late to start an investment account!
Finally, ask for help. You can hire an investment advisor, financial planner or broker that can help you make decisions on where to invest your money. U.S. News provides some tips on how to find a financial advisor, and some financial institutions also offer support for their customers. You won’t know until you ask.
2. Get to know the financial literacy standards
There is a set of unified “National Standards for Personal Financial Education” from the Jump$tart Coalition for Personal Financial Literacy and the Council for Economic Education. These standards create benchmarks for financial concepts and skills organized around six topic areas: earning income, spending, saving, investing, managing credit and managing risk. While these standards are a great resource for financial education expectations, check your individual state for implemented standards requirements. For more information about your state’s requirements, visit your state’s Department of Education website or review the “Survey of the States – 2022” for a comprehensive look into the nation’s K–12 economic and financial education progress.
3. Integrate financial literacy into your curriculum
One of the important takeaways from this blog is that financial education has been shown to have a greater effect when integrated into the curriculum [2]. It is not meant to be additional content taught in isolation, but rather a chance to give context to real-world opportunities and decision making. Providing your students with authentic scenarios that they can relate to will help them better grasp financial concepts and traditional curriculum content, consequently becoming more literate in multiple areas. There are many ways to incorporate financial education into various subject areas, but for this blog, we are going to concentrate on incorporating financial literacy into the mathematics classroom using the TI-Nspire™ CX II graphing calculator and TI-Nspire™ CX Premium Teacher Software.
One activity to consider is “Savvy About Saving.” In this activity, students are posed with a scenario that they might very well find themselves in one day. Three friends (Friend A, Friend B and Friend C) were able to secure a job at the local fast food restaurant chain. They are averaging around 40 hours a month at $15 an hour. Before any mathematics questions are posed, talk about the situation. Is it reasonable for a high school student to work 40 hours in a month? Is it reasonable to make $15 an hour? One extremely important aspect of financial education is discussion. Students need to think deeply about these authentic examples and make connections between real-world happenings and mathematics.
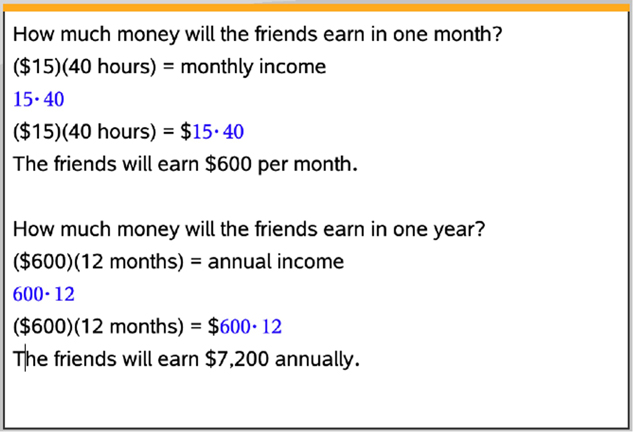
Then, ask your students about how much money each friend would make in a month? In a year? Pause for a moment to explain that this scenario is addressing gross income, or income before taxes and deductions are taken out. Using a simple calculator page or notes page (figure 2), students can compute the wages. What’s great about this software is that students can manipulate the numbers to meet a variety of needs. For instance, what if the student had a goal of making around $500 a month? They could explore how many hours they would need to work. They could then compare that to a job that pays a different amount and how that would affect their circumstances.
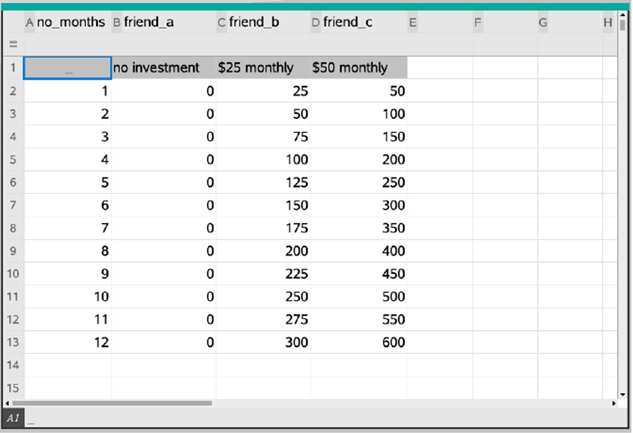
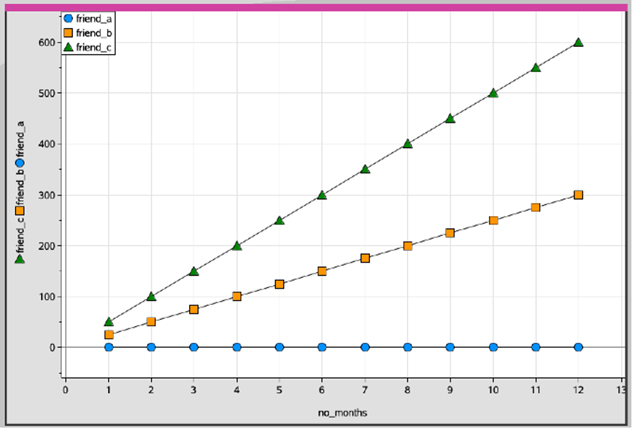
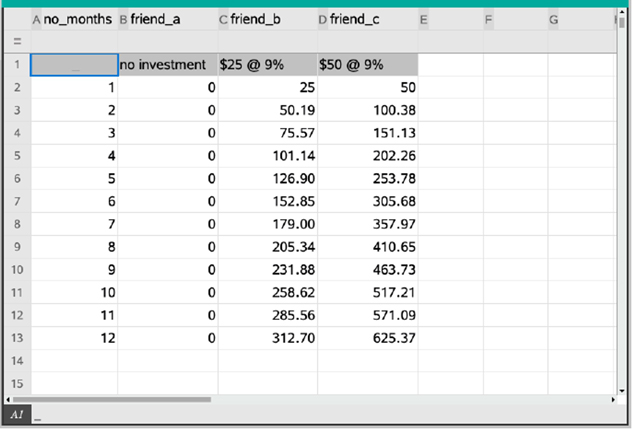
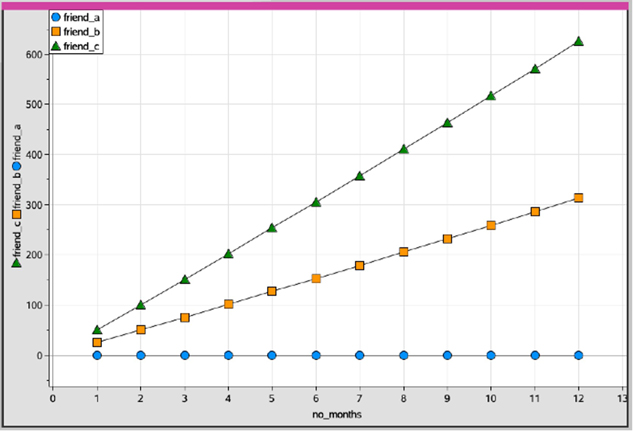
Next, you can talk with your students about saving, continuing with the three friends scenario. In their high school financial education course, they were learning about the benefits of saving money over time. Friend A decided that they would not save any money at this time. Friend B made it a goal to save $25 a month in a noninterest-paying savings account. Friend C made it a goal to save $50 a month in a noninterest-paying savings account. Many people understand that saving is a good thing, but sometimes having an actual model of its results can be very powerful. Using a Lists & Spreadsheet page, students can create a document showing how each friends’ savings add up (or don’t) over time (figure 3). They can then use a Data & Statistics page to model this progression (figure 4). Ask students what they notice about the model and discuss.
Continue the scenario by explaining that in their class, the students learned that there were ways that they could safely save and invest money (microsaving apps, Roth IRA, interest yielding savings and checking accounts, index mutual fund). This time, some of the three friends decided to place their saved money into a Roth IRA account that yielded an annual percentage rate of 9% compounded monthly. The first friend still did not want to “give up” any of their money and decided not to invest. The second and third friend chose to invest their savings (Friend B: $25/month; Friend C: $50/month). How much did each friend have after one year? Again, using a Lists & Spreadsheet page, students can organize the information to explore how compound interest will affect their savings (figure 5). Students will notice that at the same interest rate, Friend C will maintain twice as much savings as Friend B. This data can then be represented as a graph on a Data & Statistics page and appears to be linear, but with continued growth in actuality is not (figure 6). This will be explored further in the activity.
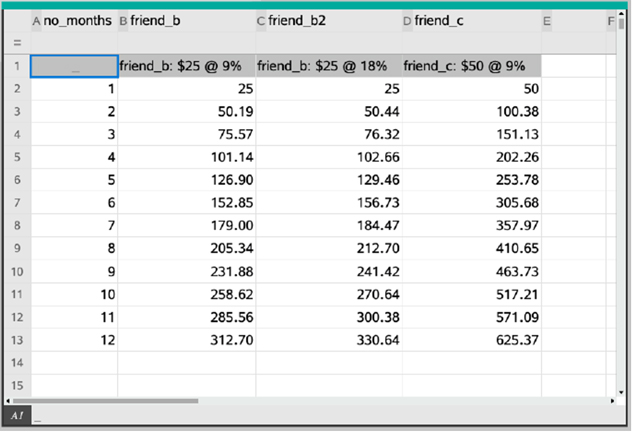
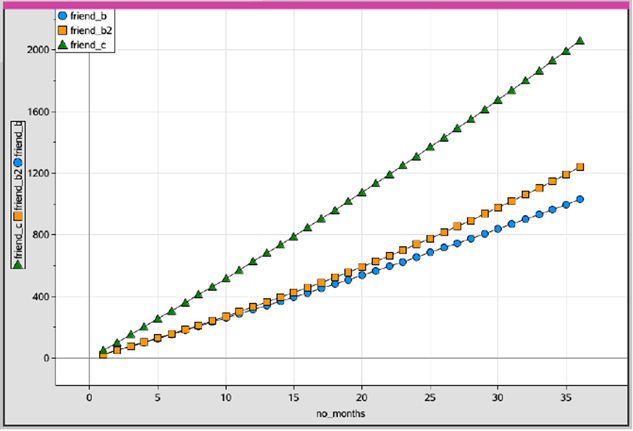
Now that students have noticed that Friend C has savings double of those from Friend B, let’s investigate a different change in the data. Ask the question: Does doubling the interest rate balance out half the investment? For instance, if Friend B were to invest their savings at 18%, instead of 9% (Friend B2), would that yield the same amount of money as Friend C’s $50 invested at 9%? Use the Lists & Spreadsheet page to show the data over a year’s time (figure 7). When using another Data & Statistics page, the graph shows that there is growth, but it is definitely not equivalent to Friend C (figure 8).

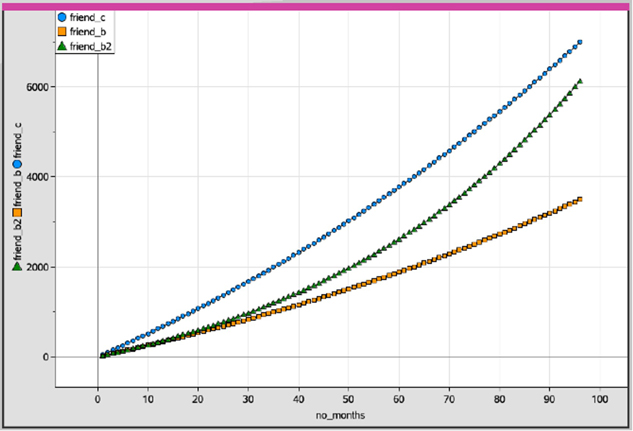
The students can then extend the data over a three-year (figure 9) and eight-year (figure 10) length of time. They will better notice that in the eight-year graph the data is not linear, which shows that the money invested at 18% is growing at a faster rate than either of the 9% investments.
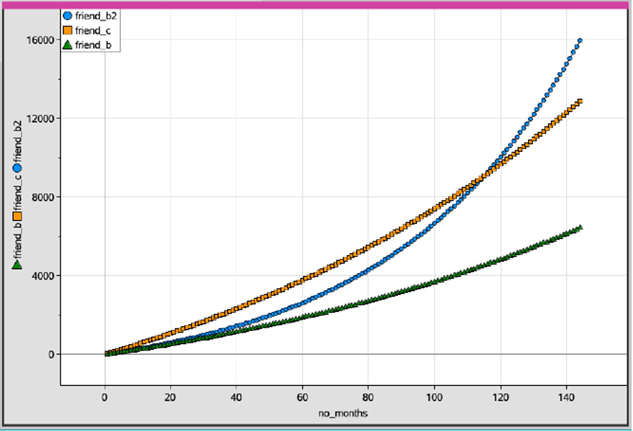
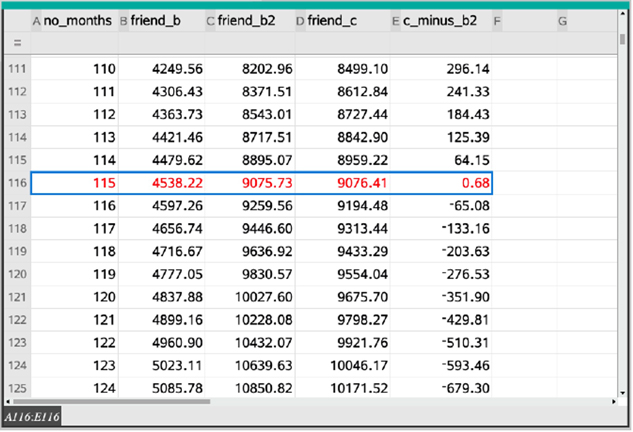
This might bring up the question, will Friend B2 eventually catch up to Friend C? The students can further extend the data to explore what the investments might look like after 12 years (figure 11). They will see that on the graph, Friend B2’s investment “catches up” to Friend C between the 100th and 120th month and surpasses it in the future. Students can then take a closer look at the data table to investigate when the investment values of Friend B2 and Friend C are closest to one another (figure 12).
This is just one of the many activities where financial literacy can be integrated into the core curricula. Tax Day also occurs in April, so an extension of this activity could include showing the students a copy of an actual pay stub and talking about the different deductions and how they are calculated. Compute the percent of the gross pay that each deduction represents, and find the total percentage deducted from the gross pay to make the net income. Cross-disciplinary discussions can involve your social studies teacher as to why we pay taxes, how they are calculated, and where the money goes. (The .tns file used in this blog can be downloaded here.)
We all want our students to become successful contributing members of our society, and providing them with authentic, integrated financial literacy activities is a way to help them attain this goal. Educate yourself, know the standards, and integrate the content to create meaningful tasks and rich discussions that can equip students with skills to last a lifetime.
About the author: Lindsay A. Gold, Ph.D., is a T³™ National Instructor and an associate professor of STEM Mathematics in the Teacher Education department at the University of Dayton. She previously taught first, fourth and fifth grades in the elementary setting and for Sinclair Community College in the Developmental Mathematics department. Her research interests include pre-service teacher education, teacher education, STEAM, financial literacy, teaching with technology, and professional development. She recently published a book titled “On the Money: Math Activities to Build Financial Literacy K–5.” Find her on Twitter @lindsayanngold.
1. Lusardi, Annamaria. “Financial Literacy and the Need for Financial Education: Evidence and Implications.” Published in Swiss Journal of Economics and Statistics 155, no. 1 (Jan. 2019): pp. 1–8.
2. Farinella, Joseph, Julia Bland, and Josep Franco. “The Impact of Financial Education on Financial Literacy and Spending Habits.” Published in International Journal of Business, Accounting, and Finance 11, no. 1 (Spring 2017): pp 1–12.