Education Technology

Statistics and Probability / Tables and Measures of Center and Spread

Grade Level 6
Activity 6 of 24
In this lesson students will focus on how to find measures of center and spread when data are organized in a frequency table.

Planning and Resources

Objectives
Students identify and interpret summary measures of center and spread using data presented in frequency tables.

Vocabulary
frequency table
mean
median
interquartile range
mean absolute deviation


Standard: Search Standards Alignment

Downloads

Lesson Snapshot

Understanding

Data summarized in frequency tables can be used to determine the mean, median, interquartile range, and MAD.

What to look for

Be sure that students understand that the mean absolute deviation represents the typical difference of the data from its mean.

Sample Assessment

The table gives the test cores of a number of students.

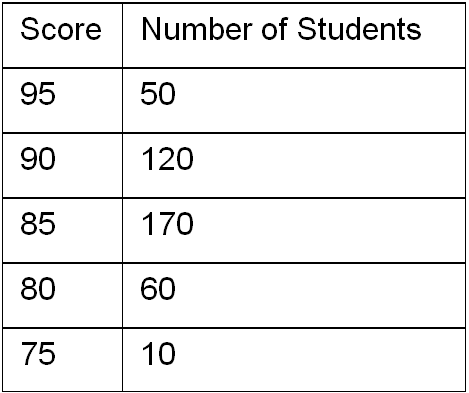
What is the median score for the students?
Answer: 85

The Big Idea

Summary measures of center and spread for a distribution of data can be determined from data presented in frequency tables.

What are the students doing?

Students investigate data summarized in frequency tables to determine the mean, median, interquartile range, and MAD for the data.

What is the teacher doing?

Be sure students use precise language when explaining what the summary measures each describe for a set of data.